Linux FTRACE setup using Terminal and GUI Application created from Python Framework
Linux FTRACE setup using Terminal and GUI Application created from Python Framework
In our development processs often it requires to know
internal call flow of module/sub system that we are concerened about for the efficieent program implementation.
In this blog we’ll kick start the process using ftrace, which is provided by
Linux Kernel.
ftrace (abbreviated from Function Tracer) is a tracing framework for the Linux kernel. ftrace is
developed primarily by Steven Rostedt, and it was merged into the Linux kernel mainline in kernel version 2.6.27, which was released on October 9, 2008.ftrace provides
few files to set the tracing parameter and tracing function.
“Ultimate Tracer”(UTracer) is a utility that I implemented
to setup the function graph parameter. Ultimate Tracer is created using python
framework and initial version that we are going to discuss further supports
only function graph.
Similar to “UTracer” GUI version , there a another version as
a command line utility. This command line utility is created out of python code.
Below is the screen shot of the command line utility that is implemented and used to set the required function graph in Linux.This utility is packaged and the same rpm can be found at UTracer Terminal Utility Download the UTracer_RPM and run script placed at /usr/bin/tracer.py.
Below is the screen shot of the command line utility that is implemented and used to set the required function graph in Linux.This utility is packaged and the same rpm can be found at UTracer Terminal Utility Download the UTracer_RPM and run script placed at /usr/bin/tracer.py.
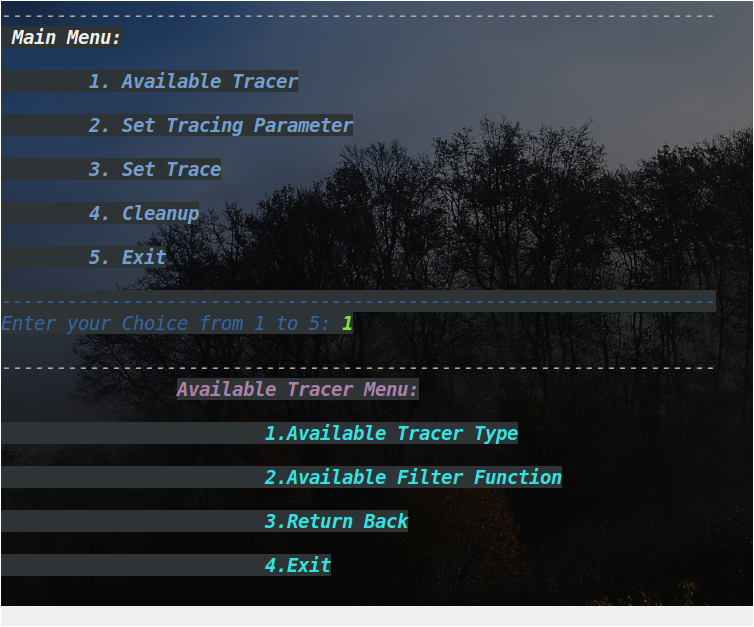


Since the command line UTracer is implemented using Python, python should be installed to execute the script with "root" privileges.
- The Main Menu gives the overall settings that can be done and each Sub Menu, gives it's own attributes/functionality.
- "Available Tracer" lists all the various option and functions that can be traced in Linux Kernel.
- "Set Tracing Parameter" will help us to set the Kernel function name and function depth for tracing.
- Through "Set Trace" Sub-Menu , we can enable , disable and get the status of the current setting.
- "Cleanup" will clear/reset all the trace parameters.
- Using "Return Back" you can go back to the it's parent Menu.
22) | blk_mq_make_request() {
22) 0.040 us | blk_queue_bounce();
22) 0.063 us | blk_queue_split();
22) 0.034 us | bio_integrity_prep();
22) | blk_attempt_plug_merge() {
22) | blk_rq_merge_ok() {
22) 0.037 us | blk_integrity_merge_bio();
22) 0.471 us | }
22) 0.035 us | blk_try_merge();
22) 1.239 us | }
22) | __blk_mq_sched_bio_merge() {
22) | dd_bio_merge() {
22) 0.036 us | _raw_spin_lock();
22) | blk_mq_sched_try_merge() {
22) | elv_merge() {
22) 0.050 us | elv_rqhash_find();
22) | dd_request_merge() {
22) 0.032 us | elv_rb_find();
22) 0.312 us | }
22) 0.868 us | }
22) 1.143 us | }
22) 1.703 us | }
22) 2.009 us | }
22) | __rq_qos_throttle() {
22) | wbt_wait() {
22) 0.028 us | bio_to_wbt_flags.isra.24.part.25();
22) | rq_qos_wait() {
22) | wbt_inflight_cb() {
22) 0.033 us | rq_wait_inc_below();
22) 0.308 us | }
22) 0.607 us | }
22) 1.165 us | }
22) 1.456 us | }
22) | blk_mq_get_request() {
22) | blk_mq_get_tag() {
22) 0.060 us | __blk_mq_get_tag();
22) 0.366 us | }
22) 0.054 us | ktime_get();
22) 0.028 us | dd_prepare_request();
22) 1.547 us | }
22) | __rq_qos_track() {
22) | wbt_track() {
22) 0.027 us | bio_to_wbt_flags.isra.24.part.25();
22) 0.324 us | }
22) 0.638 us | }
22) | blk_init_request_from_bio() {
22) 0.036 us | blk_rq_bio_prep();
22) 0.303 us | }
22) | blk_account_io_start() {
22) 0.025 us | disk_map_sector_rcu();
22) 0.027 us | part_inc_in_flight();
22) 0.040 us | update_io_ticks();
22) 0.884 us | }
22) 0.061 us | blk_add_rq_to_plug();
22) + 11.350 us | }
22) + 28.431 us | }
Are you bored of Command Line Utility.Let's create a GUI Application using Python for the same.
Below is the snapshot of the Main Menu.

The Above gui uses the same Design as that of terminal utility. UTracer GUI is created from the python framework PySimpleGUI and used latest python version for the implementation.
The Functionality of the GUI is same as that of Command Line Utility that was discussed initially in this blog. Through this I'm ending this blog on FTrace . Let's meet in next blog with some other interesting stuff.


Comments
Post a Comment